Note
Plotting polygons with Folium#
This example demonstrates how to plot polygons on a Folium map.
[1]:
import geopandas as gpd
import geodatasets
import folium
import matplotlib.pyplot as plt
Load geometries#
This example uses the nybb dataset, which contains polygons of New York boroughs.
[2]:
path = geodatasets.get_path("nybb")
df = gpd.read_file(path)
df.head()
ERROR 1: PROJ: proj_create_from_database: Open of /home/docs/checkouts/readthedocs.org/user_builds/geopandas/conda/latest/share/proj failed
[2]:
| BoroCode | BoroName | Shape_Leng | Shape_Area | geometry | |
|---|---|---|---|---|---|
| 0 | 5 | Staten Island | 330470.010332 | 1.623820e+09 | MULTIPOLYGON (((970217.022 145643.332, 970227.... |
| 1 | 4 | Queens | 896344.047763 | 3.045213e+09 | MULTIPOLYGON (((1029606.077 156073.814, 102957... |
| 2 | 3 | Brooklyn | 741080.523166 | 1.937479e+09 | MULTIPOLYGON (((1021176.479 151374.797, 102100... |
| 3 | 1 | Manhattan | 359299.096471 | 6.364715e+08 | MULTIPOLYGON (((981219.056 188655.316, 980940.... |
| 4 | 2 | Bronx | 464392.991824 | 1.186925e+09 | MULTIPOLYGON (((1012821.806 229228.265, 101278... |
Plot from the original dataset
[3]:
df.plot(figsize=(6, 6))
plt.show()
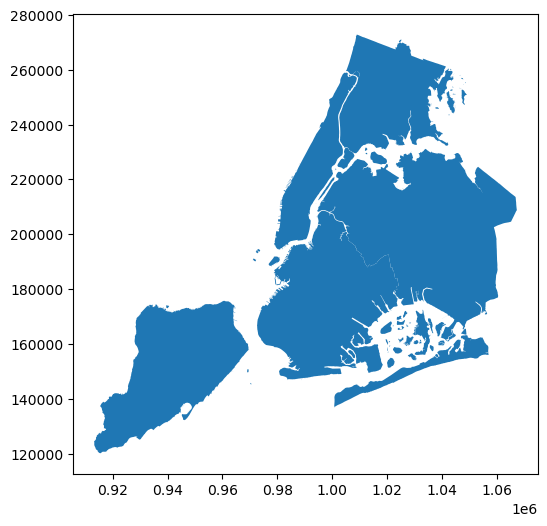
Notice that the values of the polygon geometries do not directly represent the values of latitude or longitude in a geographic coordinate system. To view the coordinate reference system of the geometry column, access the crs attribute:
[4]:
df.crs
[4]:
<Projected CRS: EPSG:2263>
Name: NAD83 / New York Long Island (ftUS)
Axis Info [cartesian]:
- X[east]: Easting (US survey foot)
- Y[north]: Northing (US survey foot)
Area of Use:
- name: United States (USA) - New York - counties of Bronx; Kings; Nassau; New York; Queens; Richmond; Suffolk.
- bounds: (-74.26, 40.47, -71.8, 41.3)
Coordinate Operation:
- name: SPCS83 New York Long Island zone (US survey foot)
- method: Lambert Conic Conformal (2SP)
Datum: North American Datum 1983
- Ellipsoid: GRS 1980
- Prime Meridian: Greenwich
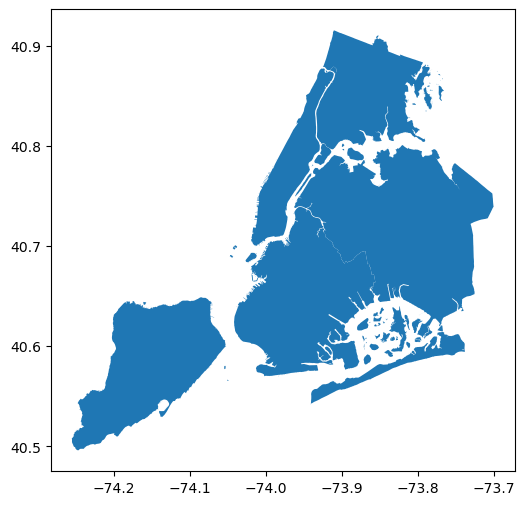
The epsg:2263 crs is a projected coordinate reference system with linear units (ft in this case). As folium (i.e. leaflet.js) by default accepts values of latitude and longitude (angular units) as input, we need to project the geometry to a geographic coordinate system first.
[5]:
# Use WGS 84 (epsg:4326) as the geographic coordinate system
df = df.to_crs(epsg=4326)
print(df.crs)
df.head()
EPSG:4326
[5]:
| BoroCode | BoroName | Shape_Leng | Shape_Area | geometry | |
|---|---|---|---|---|---|
| 0 | 5 | Staten Island | 330470.010332 | 1.623820e+09 | MULTIPOLYGON (((-74.05051 40.56642, -74.05047 ... |
| 1 | 4 | Queens | 896344.047763 | 3.045213e+09 | MULTIPOLYGON (((-73.83668 40.59495, -73.83678 ... |
| 2 | 3 | Brooklyn | 741080.523166 | 1.937479e+09 | MULTIPOLYGON (((-73.86706 40.58209, -73.86769 ... |
| 3 | 1 | Manhattan | 359299.096471 | 6.364715e+08 | MULTIPOLYGON (((-74.01093 40.68449, -74.01193 ... |
| 4 | 2 | Bronx | 464392.991824 | 1.186925e+09 | MULTIPOLYGON (((-73.89681 40.79581, -73.89694 ... |
[6]:
df.plot(figsize=(6, 6))
plt.show()
Create Folium map#
[7]:
m = folium.Map(location=[40.70, -73.94], zoom_start=10, tiles="CartoDB positron")
m
[7]:
Add polygons to map#
Overlay the boundaries of boroughs on map with borough name as popup:
[8]:
for _, r in df.iterrows():
    # Without simplifying the representation of each borough,
    # the map might not be displayed
    sim_geo = gpd.GeoSeries(r["geometry"]).simplify(tolerance=0.001)
    geo_j = sim_geo.to_json()
    geo_j = folium.GeoJson(data=geo_j, style_function=lambda x: {"fillColor": "orange"})
    folium.Popup(r["BoroName"]).add_to(geo_j)
    geo_j.add_to(m)
m
[8]:
Add centroid markers#
In order to properly compute geometric properties, in this case centroids, of the geometries, we need to project the data to a projected coordinate system.
[9]:
# Project to NAD83 projected crs
df = df.to_crs(epsg=2263)

# Access the centroid attribute of each polygon
df["centroid"] = df.centroid
Since we’re again adding a new geometry to the Folium map, we need to project the geometry back to a geographic coordinate system with latitude and longitude values.
[10]:
# Project to WGS84 geographic crs

# geometry (active) column
df = df.to_crs(epsg=4326)

# Centroid column
df["centroid"] = df["centroid"].to_crs(epsg=4326)

df.head()
[10]:
| BoroCode | BoroName | Shape_Leng | Shape_Area | geometry | centroid | |
|---|---|---|---|---|---|---|
| 0 | 5 | Staten Island | 330470.010332 | 1.623820e+09 | MULTIPOLYGON (((-74.05051 40.56642, -74.05047 ... | POINT (-74.1534 40.58085) |
| 1 | 4 | Queens | 896344.047763 | 3.045213e+09 | MULTIPOLYGON (((-73.83668 40.59495, -73.83678 ... | POINT (-73.81847 40.70757) |
| 2 | 3 | Brooklyn | 741080.523166 | 1.937479e+09 | MULTIPOLYGON (((-73.86706 40.58209, -73.86769 ... | POINT (-73.94768 40.64472) |
| 3 | 1 | Manhattan | 359299.096471 | 6.364715e+08 | MULTIPOLYGON (((-74.01093 40.68449, -74.01193 ... | POINT (-73.96719 40.77725) |
| 4 | 2 | Bronx | 464392.991824 | 1.186925e+09 | MULTIPOLYGON (((-73.89681 40.79581, -73.89694 ... | POINT (-73.86653 40.85262) |
[11]:
for _, r in df.iterrows():
    lat = r["centroid"].y
    lon = r["centroid"].x
    folium.Marker(
        location=[lat, lon],
        popup="length: {} <br> area: {}".format(r["Shape_Leng"], r["Shape_Area"]),
    ).add_to(m)

m
[11]: